In 2004, the mighty oak was selected as America’s tree in a nationwide vote organized by the National Arbor Day Foundation. Oak bested redwood 101,000 to 81,000. Dogwood, maple and pine rounded out the top five trees receiving the most votes cast by citizens of all ages.
Oak is the most widespread of hardwoods with more than 60 species growing in the United States. Oak is prized for its strength, beauty and furniture-grade lumber. Due to its endearing and enduring qualities, it’s little wonder that oak is also the official tree of six states: Connecticut, Georgia, Illinois, Iowa, Maryland and New Jersey.
Each of these textured RTFs can be flat-laminated, post-formed, membrane-pressed, miter-folded and profile wrapped for use in commercial and residential furniture, store fixtures, kitchen cabinets, closet systems and much more.
Illinois is observing OAKtober, a month-long celebration of white oak, the official state tree.
In addition to the Land of Lincoln, variations of oak are the state trees of five other states including:
Connecticut, Charter oak;
Georgia, lively oak;
Iowa, bur oak;
Maryland, white oak; and
New Jersey, northern red oak.
Synergy Thermal Foils crashes the party with Carolina Oak, a new textured RTF destined to become a favorite for furniture and cabinets. Carolina Oak is one of four oak designs that we are introducing, the others being Highlands Oak, Charleston, and Williamsburg. Each of these new oak designs has a TFL match with Funder America.
All of our new products can be flat-laminated, post-formed, membrane-pressed, miter-folded, and profile wrapped for use in commercial and residential furniture, store fixtures, kitchen cabinets, closet systems, and much more.
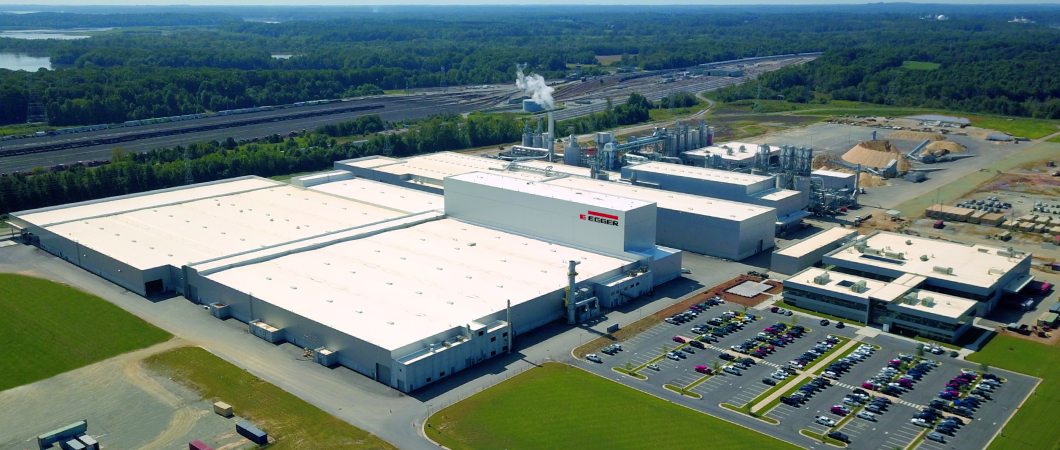
Egger Wood Products, one of our Matching Program partners, offers a “virtual tour” of its $500 million manufacturing plant in Lexington, NC, that began operating last fall.
.
The tour features 13 segments, each focusing on a different area of the 1-million-square-foot facility spanning from the woodyard through the design center. In between our highlights of the plant’s automated systems for manufacturing particleboard and thermally-fused laminate.
A recent survey by the Composite Panel Association revealed that more than three-quarters of its members worry that federal COVID-19 vaccine mandates will result in the loss of employees, further worsening a dearth of production workers.
The CPA survey was triggered by President Joe Biden’s executive order calling for the Occupational Safety and Health Administration to develop an emergency workplace standard. Companies with more than 100 employees would require all employees to either be fully vaccinated or be subject to weekly COVID-19 testing.
While the timing and specifics of an OSHA emergency standard are not yet known, survey respondents are concerned mill production might be negatively impacted. Some participants said the potential of employees quitting as the result of vaccine orders could result in production disruptions.
The OSHA emergency standard is part of the Biden Administration’s six-pronged, national strategy to encourage more Americans to get vaccinated to combat COVID-19.
Three woodworking organizations partnered to produce a six-minute video that is airing on public television stations nationwide to create awareness of career opportunities in the wood products industry.
The video, produced by “In Depth with Laurence Fishburne,” an award-winning educational television series highlighting the evolution of education, medicine, science, technology, and industry through inspiring stories. It was funded by the Association of Woodworking & Furnishings Suppliers (AWFS), Architectural Woodwork Institute (AWI), and Woodwork Career Alliance of North America (WCA). In addition, a one-minute commercial version of the video (below) was produced. It will air on Fox Business Network and other cable networks.
The program showcases the operations of Hollywood Woodwork, a high-end commercial architectural woodworking firm in Hollywood, FL. It introduces the audience to potential careers in a modern woodworking facility using advanced machinery in a safe and clean environment.
Those interviewed in the video discuss skills needed for wood industry careers, education and training opportunities, and various career pathways available.
New orders for residential furniture are continuing to roll, rising 7% in June compared to June 2020, according to accounting firm Smith Leonard. In its August 2021 Furniture Insights, Smith Leonard noted that June’s increase is especially special when considering that June 2020 registered a 30% increase over June 2019.
New furniture orders have now recorded 13 months of year-over-year growth.
“Year to date, new orders were up 51% over the first half of 2020 and up for 94% of the participants,” said Ken Smith, managing partner of Smith Leonard. “For comparison, new orders in the first 6 months of 2021 were up 37% over the first 6 months of 2019. We continue to think that the comparisons to 2020 for the rest of this year will be tough to beat.”
Smith noted that furniture shipments are being hampered by supply shortages. “Freight issues are a major problem, with container shortages continuing, causing significant price increases, if you can even get them,” Smith said. “Some are blaming some of the large retailers for tying up containers. Labor issues continue. We have read articles about how many are just not looking for jobs. Reasons include not only government stimulus and increases in unemployment checks, but also some have taken the opportunity to start their own small businesses. Some have decided to just retire, and some point to cost of daycare, making it better to just stay home. Others have pointed to the fear of contracting COVID-19.”
Backlogs continued to increase as orders in dollars exceed the dollar value of shipments. Backlogs were 153% higher in June than in June 2020, according to Smith Leonard.
“Expectations are for the overall economy to continue to expand, although at a slower rate, but still expectations are for over 4% into 2022,” Smith said. “We would think that the furniture business should continue its expansion as well, with shipments continuing to grow as backlogs are brought down. This would indicate that volume does not appear to be the issue. Profitability may be the problem as costs are going up faster than price increases can be put in place. It is hard to anticipate three months out, when products will be made, based on price lists being put out today.”
Design trends come and go but the popularity of oak as a favorite for furniture and cabinets endures. Synergy Thermal Foils has expanded its oak offerings with the introduction of four new designs: Highlands Oak (shown), Carolina, Charleston, and Williamsburg. Each of these new textured oaks is a perfect match with TFL panels from Funder America. Our versatile and durable family of products can be flat-laminated, post-formed, membrane-pressed, miter-folded and profile wrapped for commercial and residential furniture, store fixtures, kitchen cabinets, closet systems and much more. synergythermofoils.com
In a year marked by economic fits, the U.S. housing market proved surprisingly resilient in 2020.
According to the U.S. Department of Housing and Urban Development and the U.S. Census Bureau, housing starts hit1.55 million annualized units in November, up 2.8% from the year before. Meanwhile, sales of newly built, single-family homes in November stood at 841,000 on an annualized rate, 20.8% higher than November 2019.
Economists for a wide variety of organizations see even better days to come for the housing industry in 2021. Here are highlights of some of those rosy forecasts.
National Association of Home Builders: Home builder confidence enters 2021 at near record highs. New home sales growth will likely slow but will remain strong due to a “shifting geography of housing demand to lower-density markets and historically low interest rates.” Home builders will continue to face higher costs for materials and contend with an ongoing labor skills shortage. “Remodeling demand should remain strong and expand further.”
Realtor.com: “We expect housing’s winning streak to continue in 2021 as seasonal trends normalize and some of the frenzied momentum fades thanks to fresh affordability challenges.” Single-family starts are seen increasing 9%.
Redfin: “The housing market will remain strong through 2021 as the economy recovers from the pandemic-driven recession.” Among Redfin’s 2021 predictions:
Mortgage rates will rise slowly but remain historically low at 3%;
There will be more home sales than in any year since 2006, but price growth will slow.
More new homes will be built next year than in any year since 2006… Building permits were up 21% from September to November compared to the same time the year before year.
The number of Americans relocating will be the highest it has been in 16 years. In 2021, the number of Americans moving across county lines will surpass 14.5 million, as everyone settles into their post-pandemic ways of living. That will be more than a 25% increase in out-of-town movers from 2018 when 11.4 million Americans moved across county lines.
Zillow: “(We) expect a perfect storm of market conditions to create the hottest spring shopping season in recent memory, with sales happening quickly and often above list price. It’s likely COVID-19 vaccine distribution will be well underway in the U.S. by the spring, and local economies and schools should be in the process of opening back up. Many will also have more certainty about whether their jobs will be performed remotely in the long term, adding buyers to the market who had been waiting for that to be settled. Add in expectations for mortgage rates to rise later in the year, and we could see a buyer frenzy as they look to lock in rates as low as possible.
“2020 has been a remarkably strong year for the housing market, with sales on pace to grow 6% from 2019 despite essentially pressing ‘pause’ for a few weeks in the heart of the spring shopping season. We expect that mark will be shattered next year, forecasting 21.9% annual growth for a total of 6.9 million homes sold. That would be the biggest annual sales growth since 1983.”
In this issue of On the Surface, we say hello to 2021; shine a spotlight on Ginger Spicewood and take sneak a peek at what economists expect will be a very good year for the U.S. housing industry.
Gearing Up for 2021
Dear Colleagues,
2020 was a year that none of us will ever forget. We watched in disbelief as a year that began with great optimism was hijacked by a global pandemic that dramatically altered the way we work and live.
While we are happy to have 2020 in the rearview mirror, we are also grateful to all of you who supported Synergy during the most extraordinary of times. It wasn’t always easy, but we not only survived the worst that the pandemic could throw at us, we’ve emerged stronger than ever. We’re excited to watch the New Year unfold and see what new opportunities avail themselves.
We greatly look forward to continuing to serve you as the most-trusted source of 3D Laminates, 2D Laminates and Foils.
Thank you and good luck!
Your friends at Synergy Thermal Foils
Product Spotlight: Ginger Spicewood
Our Ginger Spicewood brings out oak’s zesty design flavor further enhanced by Authentic texture, the same structure we use with Barnwood and Smokewood.
Request a sample. (Be sure to include your name, company name, address and phone number.)
Bullish on Housing
In a year marked by economic fits, the U.S. housing market proved surprisingly resilient in 2020.
According to the U.S. Department of Housing and Urban Development and the U.S. Census Bureau, housing starts hit1.55 million annualized units in November, up 2.8% from the year before. Meanwhile, sales of newly built, single-family homes in November stood at 841,000 on an annualized rate, 20.8% higher than November 2019.
Economists for a wide variety of organizations see even better days to come for the housing industry in 2021. Here are highlights of some of those rosy forecasts.
National Association of Home Builders: Home builder confidence enters 2021 at near record highs. New home sales growth will likely slow but will remain strong due to a “shifting geography of housing demand to lower-density markets and historically low interest rates.” Home builders will continue to face higher costs for materials and contend with an ongoing labor skills shortage. “Remodeling demand should remain strong and expand further.”
Realtor.com: “We expect housing’s winning streak to continue in 2021 as seasonal trends normalize and some of the frenzied momentum fades thanks to fresh affordability challenges.” Single-family starts are seen increasing 9%.
Redfin: “The housing market will remain strong through 2021 as the economy recovers from the pandemic-driven recession.” Among Redfin’s 2021 predictions:
Mortgage rates will rise slowly but remain historically low at 3%;
There will be more home sales than in any year since 2006, but price growth will slow.
More new homes will be built next year than in any year since 2006… Building permits were up 21% from September to November compared to the same time the year before year.
The number of Americans relocating will be the highest it has been in 16 years. In 2021, the number of Americans moving across county lines will surpass 14.5 million, as everyone settles into their post-pandemic ways of living. That will be more than a 25% increase in out-of-town movers from 2018 when 11.4 million Americans moved across county lines.
Zillow: “(We) expect a perfect storm of market conditions to create the hottest spring shopping season in recent memory, with sales happening quickly and often above list price. It’s likely COVID-19 vaccine distribution will be well underway in the U.S. by the spring, and local economies and schools should be in the process of opening back up. Many will also have more certainty about whether their jobs will be performed remotely in the long term, adding buyers to the market who had been waiting for that to be settled. Add in expectations for mortgage rates to rise later in the year, and we could see a buyer frenzy as they look to lock in rates as low as possible.
“2020 has been a remarkably strong year for the housing market, with sales on pace to grow 6% from 2019 despite essentially pressing ‘pause’ for a few weeks in the heart of the spring shopping season. We expect that mark will be shattered next year, forecasting 21.9% annual growth for a total of 6.9 million homes sold. That would be the biggest annual sales growth since 1983.”
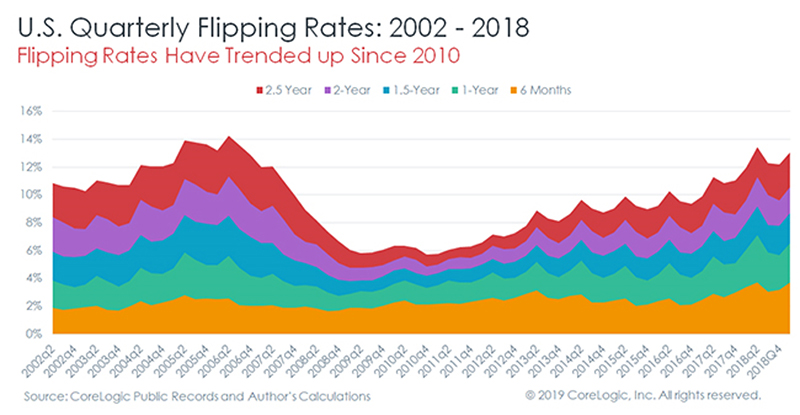
Home flipping is on the rise, nearly back to the same level it was around the peak of the housing bubble in 2006. However, this time around it does not cause concern for many economists as the flips are less risky.
According to a recent report from Core Logic Inc, that has been tracking house flipping data since 2002, stated that the flipping* rate has increased on a year over year basis for 12 consecutive quarters. 2018 fourth quarter flipping rate was at 10.9% of home sales, compared to first quarter of 2006 which was at 11.3%.
The biggest markets for house flipping falls mostly along the sun belt with Birmingham, AL at 16.5% followed by Memphis, TN (16.22%), Tampa, FL (15.1%), and Las Vegas, NV (15%). Other markets with high average rates are New Jersey, Arizona, Pennsylvania and Georgia.
At the low end of the home flipping rates areas such as Austin, TX (4.3%), Bridgeport, CT (4.4%), Hartford, CT (5.1%), and New Haven, CT (5.3%) along with other parts of Texas, Massachusetts, Illinois and Wisconsin.
This time around house flipping is more based on adding value and speculating on prices. Adding value to older homes is has been key to ensure there is no market volatilely. This allows entry level homes back to the market without large costs for first time home buyers (entry level homes are desperately needed on the market due to a lack of supply). One of the key takeaways from the housing bust was that a large part of the flipping industry was based on speculation on future home prices.
*House flipping rate is determined as a percentage of total home sales that have been owned for less than two years.
U.S. job openings fell in February to the lowest level in nearly a year. Seasonally adjusted, there was 7.09 million unfilled jobs in February, down by more than 500,000 from January.
While job openings may have fallen, unemployment rates have stayed at very low levels, for both February and March, the unemployment rate stayed at 3.8%.
 In 2004, the mighty oak was selected as America’s tree in a nationwide vote organized by the National Arbor Day Foundation. Oak bested redwood 101,000 to 81,000. Dogwood, maple and pine rounded out the top five trees receiving the most votes cast by citizens of all ages.
 A recent survey by the Composite Panel Association revealed that more than three-quarters of its members worry that federal COVID-19 vaccine mandates will result in the loss of employees, further worsening a dearth of production workers.
 Smith noted that furniture shipments are being hampered by supply shortages. “Freight issues are a major problem, with container shortages continuing, causing significant price increases, if you can even get them,” Smith said. “Some are blaming some of the large retailers for tying up containers. Labor issues continue. We have read articles about how many are just not looking for jobs. Reasons include not only government stimulus and increases in unemployment checks, but also some have taken the opportunity to start their own small businesses. Some have decided to just retire, and some point to cost of daycare, making it better to just stay home. Others have pointed to the fear of contracting COVID-19.”
 Design trends come and go but the popularity of oak as a favorite for furniture and cabinets endures. Synergy Thermal Foils has expanded its oak offerings with the introduction of four new designs: Highlands Oak (shown), Carolina, Charleston, and Williamsburg. Each of these new textured oaks is a perfect match with TFL panels from Funder America. Our versatile and durable family of products can be flat-laminated, post-formed, membrane-pressed, miter-folded and profile wrapped for commercial and residential furniture, store fixtures, kitchen cabinets, closet systems and much more.
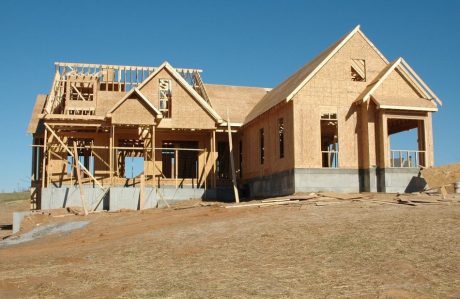 In a year marked by economic fits, the U.S. housing market proved surprisingly resilient in 2020.