House Flipping Rates Near Historic Highs
April 2019Home flipping is on the rise, nearly back to the same level it was around the peak of the housing bubble in 2006. However, this time around it does not cause concern for many economists as the flips are less risky.
According to a recent report from Core Logic Inc, that has been tracking house flipping data since 2002, stated that the flipping* rate has increased on a year over year basis for 12 consecutive quarters. 2018 fourth quarter flipping rate was at 10.9% of home sales, compared to first quarter of 2006 which was at 11.3%.
The biggest markets for house flipping falls mostly along the sun belt with Birmingham, AL at 16.5% followed by Memphis, TN (16.22%), Tampa, FL (15.1%), and Las Vegas, NV (15%). Other markets with high average rates are New Jersey, Arizona, Pennsylvania and Georgia.
At the low end of the home flipping rates areas such as Austin, TX (4.3%), Bridgeport, CT (4.4%), Hartford, CT (5.1%), and New Haven, CT (5.3%) along with other parts of Texas, Massachusetts, Illinois and Wisconsin.
This time around house flipping is more based on adding value and speculating on prices. Adding value to older homes is has been key to ensure there is no market volatilely. This allows entry level homes back to the market without large costs for first time home buyers (entry level homes are desperately needed on the market due to a lack of supply). One of the key takeaways from the housing bust was that a large part of the flipping industry was based on speculation on future home prices.
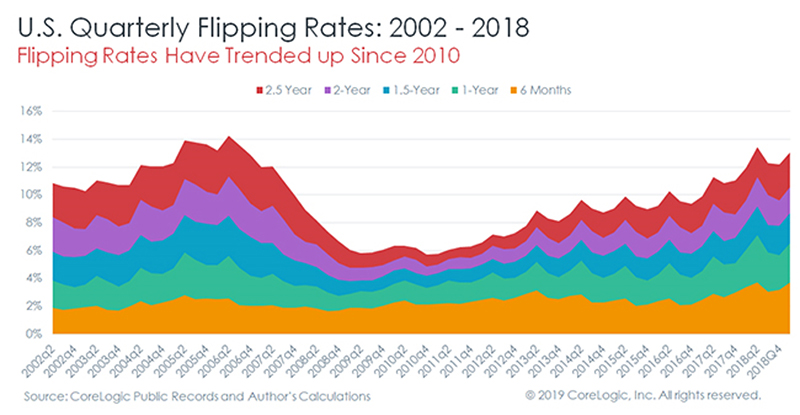
*House flipping rate is determined as a percentage of total home sales that have been owned for less than two years.