Confidence High Across the Board
October 2018
Consumer confidence hit an 18 year high in September, a very positive indicator for spending going into the holiday shopping season. The Conference Board Index measured consumer confidence at 138.4, up from 134.7 in August. This is the highest it has been since September 2000. (An index reading of 100 represents how household saw the economy in 1985).
A high consumer confidence is a good sign for the third quarter GDP, since consumer spending attributes to about 70% of GDP and economist are forecasting GDP growth at 3.3% for the third quarter. While some economist have voiced concerns about current trade tensions between the U.S and our trading partners, the consumer has not felt the effect of it.
In the continuing trend of increasing confidence and outlook, the National Association of Manufacturers (across all industries) are reporting exceeding high (92.5% of respondents) outlook for the third quarter. This is on pace for the highest yearly reading of the surveys 20 year history. Outlook for the fourth quarter is at 93.9% positive, making it the highest one-year average on record. Optimism for small manufacturers increased in by 1.8% from Q2 to Q3 to 91.3%.
Builder confidence remains unchanged in September from August at 67 according to the National Association of Home Builders/Wells Fargo Housing Market Index. Builders remain confident that the growing economy and rising incomes will allow more individuals to pursue buying new homes. Even with housing affordability becoming a challenge, many builders maintain a positive outlook for September.
IWF 2018 in Review
September 2018
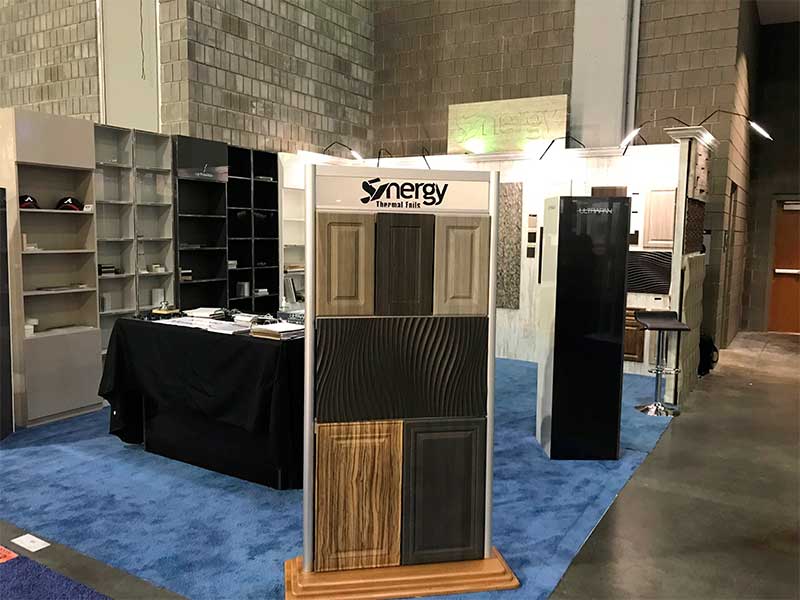
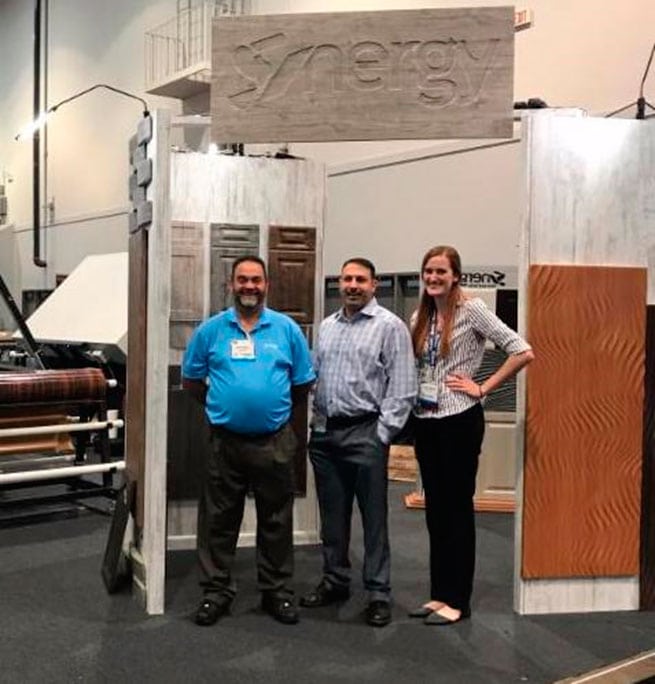
After a flurry of excitement, Synergy Thermal Foils will put IWF 2018 down in the books as a great success! The International Woodworking Fair (IWF) is a biennial event and was hosted in Atlanta, Georgia on August 22-25, 2018. With over 1,000 exhibitors that spanned over 1 million square feet, thousands of people from the woodworking, manufacturing, design and other industries walked the halls in awe of the latest products and technology that woodworking has to offer.
STF stood out from the crowd with our display which highlighted the range of products that can be finished using thermofoil. From cabinet doors to decorative wall panels, moldings to health care tables; the possibilities with thermofoils is endless.
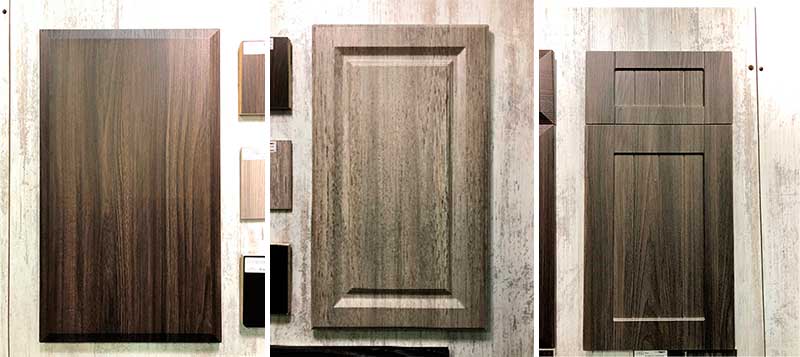
Introduced for this show, our newest additions to our 3D laminate collection, Elmwood, Ember and Tete-e-tete garnered much attention. These three designs features a unique texture and design combination that catches the eye. Throughout the show, we fielded the question “Is this real wood?” and many people were astonished that it was in fact thermofoil. All three of the designs have TFL matches: Elmwood matches Uniboard’s Driftwood (H70) and Stevens Industries Ontano (L04), Ember matches Uniboard’s Ember (H53), and Tete-e-Tete matches Tafisa’s Tete-e-Tete (M2001) and Uniboard’s Silva (H50).
Additionally on display was STF’s TFL and HPL matching program. With our customers in mind, we try to introduce not only leading trends and designs but also to ensure that our RTF stocking program has matches to major TFL and HPL producers across North America. Matches from companies such as Uniboard, Tafisa, Dixie-Funder, Formica and more were all on display.
Outside of Synergy’s own booth, our products were on display at other prominent booths. Genesis Products had a display of miter-folded boxes that utilized Synergy’s Smokewood foil. Italpress had a beautiful display of a unique wall panel system utilizing STF’s Memento, Silverwood and Barnwood.
Overall 2018’s IWF was a whirlwind experience and will be talked about for months to come.
Whether you were able to attend and saw the breathtaking new colors or unable to go to this year’s IWF because of your own hectic schedule but still want to see the new designs, please email info@synergythermofoils.com for sample requests.

Employment and Wages Catching Up with a Roaring U.S. Economy
September 2018
Without a shadow of a doubt, the U.S. economy has been on a rampage in recent months. Growing beyond expectations within multiple economic indicators. Effects of the booming economy are being felt by every person from the average worker to the largest corporations.
Second quarter GDP has been reported at 4.2% at an annualized rate; almost double the Q1 reports. GDP growth has been largely attributed to larger consumer spending and an increase in soy exports for the second quarter. This is the strongest growth rate since Q3 of 2014.
Private domestic business investment has been steadily on the rise following the 2017 tax plan implemented, reaching nearly $596 billion for Q2. Investment as a percentage of the economy is at about the same level of the mid-2000’s boom.
Consumer confidence is on the rise as well, up 5.5 points in August according to the Conference Board. The index now stands at 133.4 (1985 = 100), up from 127.9 in July. The present situation index improved from 166.1 To 172.2 and the expectations index also increased from 102.4 last month to 107.6 this month.
“Consumer confidence increased to its highest level since October 2000 (Index, 135.8), following a modest improvement in July,” said Lynn Franco, Director of Economic Indicators at The Conference Board. “Consumers’ assessment of current business and labor market conditions improved further. Expectations, which had declined in June and July, bounced back in August and continue to suggest solid economic growth for the remainder of 2018. Overall, these historically high confidence levels should continue to support healthy consumer spending in the near-term.”
Unemployment remains at historically low levels for August, unchanged at 3.9%. Nonfarm payroll employment increased by 201,000. Job gains occurred in professional and business services, health care, wholesale trade, transportation and warehousing and mining. A broader measure of unemployment that includes individuals who are unemployed but have given up looking for work fell to 7.4 %, the lowest level since April 2001.
With many indicators pointing towards a rocking economy, one thing has remained a drag on growth; wages. That is starting to change. Average hourly earnings have increased 0.4% in August following a 0.3% increase in July. This has raised annual increases in wages to 2.9%, the largest increase since July 2009. However, this has matched the current rate of inflation (compared to previous months where the rate of inflation outpaced wage growth). If the inflation rate remains steady finishing out Q3 and going into Q4, wage growth is likely to surpass that by the end of 2018.
Cabinet Sales Increase Year Over Year
September 2018
July has reported an increase in cabinet sales of 3.8% for July over the same time frame during 2017 according to the Kitchen Cabinet Manufactures Association (KCMA)’s monthly Trend of Business Survey. Participating cabinet manufactures have notated that stock sales has increased by 9.2%, custom sales increased 8.4%, however semi-custom sales decreased 3.1% year over year.
Year to date cabinetry sales through July 2018 are up 1.5%, stock sales are up 3.2%, semi-custom decreased 1.1% and custom sales are up 3.9% so far this year.
Survey participants include stock, semi-custom, and custom companies – companies that belong to KCMA represent combined sales of approximately 70% of the U.S. kitchen cabinet and bath vanity market.
U.S. Furniture Sales Up 5%
September 2018
In tune with other manufacturing markets, U.S. furniture manufacturers have reported a 5% increase in sales during July 2018 over the previous month. From the recent survey of residential furniture manufacturers and distributors completed by Smith and Leonard, this 5% increase has been a consistent trend over the past couple of months. June experienced a 5% increase over May and May experienced a 15% increase over April. Year to date, orders are up 6% over 2017 with over 60% of participants reporting increased orders.
Join STF at booth 553! IWF 2018
July 2018
Synergy Thermal Foils will be exhibiting at this years IWF in Atlanta on August 22-25, 2018. Stop by booth 553 to see the latest additions to our 3D laminate collection.
For complimentary tickets, please contact us by phone at 954-4209553 or by email to- promotions@synergythermofoils.com
The International Woodworking Fair (IWF) is the largest trade show in North America for the furniture manufacturing, architectural woodwork, custom and general woodworking industries.
Shoot for the Stars!
July 2018
STF was aiming for the stars with our latest addition to our 3D laminate collection: Star Elm.
Star Elm is a grey wood grain design that is bound to please even Hollywood stars. This realistic wood grain will make any project big or small stand out.
The matching TFL can be found with Uniboard (Hi Teak 511).

U.S. Hiring Continues to Grow Despite Unemployment Rate Increase
July 2018
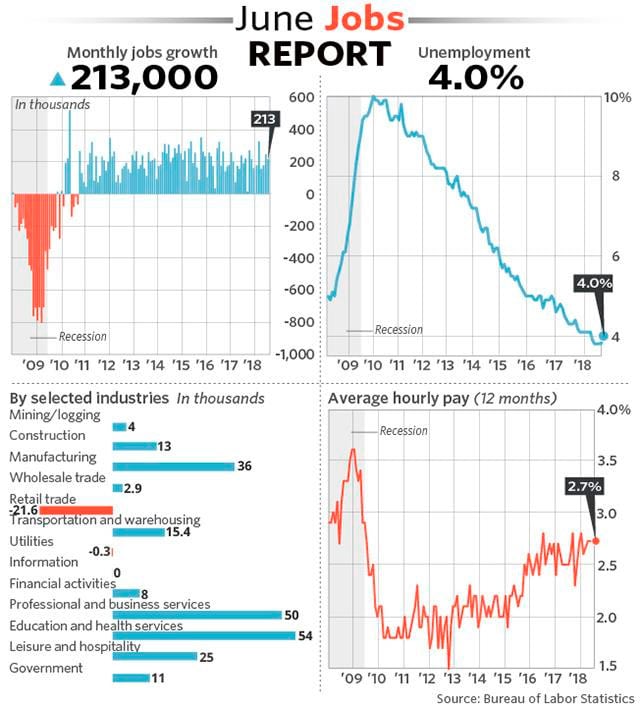
As our robust economy continues to ramp up, employers added 213 non-farm jobs to the payroll in June according to the Labor Department. Despite original forecasts of 200,000 by economists, unemployment rate crept up to 4%, up from 3.8% in May.
While the unemployment slightly increased it was largely due to an influx of eligible workers added to the labor market. Recent graduates, parents or others previously frustrated by their prospects have entered or reentered the labor force causing the labor force to grow an average of 250,000 workers each month this year. In June, the share of American adults working or looking for a job rose 0.2% to 62.9%.
The shrinking pool of labor is slowly forcing companies to raise pay as the competition for talent intensifies, but they are still managing to keep labor costs down. Hourly wages rose a modest $0.05 to $26.98. The yearly rate of pay increases was unchanged at 2.7%, sitting slightly lower than the current rate of inflation which reached 2.9% in June.
A White Hot Color!
June 2018
STF is proud to introduce the latest color to our 3D laminate collection: Designer White.
According to the annual study of kitchen trends by Houzz, the most popular color for kitchens is white. Our designer white is a brilliant white that would look amazing in kitchens of all sizes.
With matches from Wilsonart, Aracuo, Tafisa, Uniboard and many others, please remember to always verify matches. The possibilities are endless for your finished project.

The State of U.S. Housing (A Series)
June 2018
Part 3: Home Prices and Rent Growth
Over the past couple of months, STF has released a series of articles analyzing the U.S. housing market called “The State of U.S. Housing”. Part 1 focused on too many buyers and not enough homes. Part 2 took a look at high construction costs and public policy that hinders new construction. This month will dive deeper into home prices and the impact stagnant wage growth has had on the market.
The lack of new housing supply has been the driving force behind home values. On the national level, home prices have regained most or all of the ground lost during the recession. Home prices have risen year over year an average between 5% and 7% in the last 5 years, 2018 first quarter saw an increase of 6.9% over the same time period in 2017. While an increase in home price is fantastic news to the seller, for many buyers including first time home buyers, they are being priced out of the market. Heavy demand has led to massive bidding wars and many people have resorted to paying above asking price.
With a robust economy many economist assumed wages would rise naturally, however that has not been the case for many employees. Growth in average hourly earnings has had mediocre increases year over year averaging between 2.5% and 2.7% yearly since 2010. This increase in wages are slightly higher than the yearly rate of inflation which has remained steady at 2.2% for the past 5 years.
Not only has wage growth been stagnant but increases in average monthly rent have actually surpassed inflation. According to Zillow and the Zillow Rent Index (ZRI) rent growth has increased 2.5% annually. This along with the stagnant wage growth indicates that people have not been able to increase savings or have had to decrease savings for general living costs. For many first time home buyers, this has been the hurdle they are trying to overcome, the inability to save or increase savings for higher priced homes has shut the door on the dream of home ownership.
Unemployment Lowest in Nearly Two Decades
June 2018
The U.S. labor market has surpassed expectations yet again, according to the U.S. Labor Department non-farm payroll added 223,000 jobs in May.
The increase in job openings has further pushed the unemployment figure down to 3.8%, the lowest in it has been since 2000. The labor department is now reporting that there are more job openings in the U.S. than people to fill them, there is an estimated 6.7 million job openings at the end of April with an estimated 6.3 million unemployed.
While the unemployment figure is indicative of a roaring economy, some employers are beginning to feel the strain. A tight labor pool has made it increasingly difficult for employers to fill open positions with adequate candidates. Many employers are facing a pool of unqualified people to work and in turn have begun to increase wages and incentives to attract more qualified individuals.
The State of U.S. Housing
May 2018
Part 2: Higher Costs and Public Policy
STF will be releasing a series of articles analyzing the U.S. housing market called “The State of US Housing”. The importance of the real estate sector on the U.S. economy cannot be overstated. More than half of the private wealth in the U.S. is composed of real estate assets, with $25 trillion in residential and $15 trillion in commercial. Even modest changes in the market can have massive ramifications in the U.S and globally as the world experienced following the bubble burst in 2009. So each month we will dive into various factors that are driving the current housing market.
Last month’s issue of The State of U.S. Housing focused on the effects of low supply and high demand. A robust economy has provided many Americans the opportunity to purchase a home, however with low construction rates and a high demand many are experiencing difficulties in purchasing a home.
This month will focus on the constraints that are limiting supply growth in the housing market, more specifically into construction costs and the impact of housing policies.
Housing starts rose 1.9% in March to a seasonally adjusted annual rate of 1.319 million units according to the Commerce Department. Despite the rebound in homebuilding last month, activity appears to be slowing. Single-family homebuilding, which accounts for the largest share of the housing market, fell 3.7% to a rate of 867,000 units in March.
New residential construction has remained at historically low levels following the 2008-2009 bubble burst. On a population-adjusted basis, housing starts averaged the equivalent of 2.5 million units per year from 1960 through 2005. From 2006 through February 2018, starts have averaged the current equivalent of just 1.1 million units per year, where 1.3 million units per year is required to maintain a balance in the population growth.
One of the biggest constraints facing new construction is the large increase in construction costs over the past 10 years. Annual inflation rates in the U.S. has averaged 2.2% over the past 25 years, according to the Bureau of Labor Statistics, close to the Federal Reserve’s goal of 2%. However, construction cost inflation has nearly doubled the pace of the annual, reaching an average of 4% per year, with costs of goods already reaching 4% increase during the first 4 months of 2018. The graph below indicates the change in costs for goods in residential construction based on the Producer Price Index (PPI) released by the Bureau of Labor Statistics.
Not only are builders facing higher costs but recent policies enacted by the current administration has started to drive building costs even higher. Tariffs placed on Canadian lumber and other imported products are pushing up prices and hurting housing affordability.
The need for entry level homes is at an all-time high with the large influx in demand for homes coming from the millennial generation. However, increases in costs have dwindled a builder’s desire for completing entry level homes. Instead most builders are focusing on mid-range and higher homes due to larger margins.
The next major limitation on new housing construction comes from public policy on housing such as land-use zoning and affordable housing policies. State and local governments limit land development based on zoning policies, this in turn makes it more difficult for developers to find suitable lots to build on.
Additionally, “Not in my backyard” groups (NIMBY) have started to have major influence on new land development through community outreach and action. Neighborhoods in Seattle don’t want apartments for homeless seniors; in Los Angeles, they don’t want more high rises; in San Jose, CA they don’t want tiny homes and the list goes on and on. All these are types of housing that could help alleviate some immediate housing issues, yet NIMBY groups oppose them at all costs. Worried that these new housing forms will not only hurt their home value but burden public services such as schools, roads and transportation, NIMBY groups continue to have an enormous impact on the development of housing.