AWFS in Review: Synergy Slays with Solids
August 2017

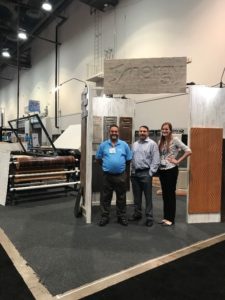
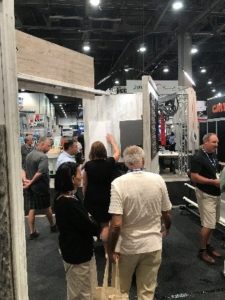
 This year’s AWFS Fair was a whirlwind experience like no other. Hosted in Las Vegas, Nevada on July 19-22, 2017, the biennial event boasted a 17% attendance increase over 2015. With over 18,000 participants, there was a flurry of excitement in the packed halls with everyone eager to see the latest technology and design trends.
Synergy’s unique showcase of decorative wall panels attracted attention from everyone who walked by. Many people stopped simply to touch the panels; surprised that the visual design also felt like real wood. Attendees were amazed by the range of finished products that can utilize thermofoil such as healthcare tables, decorative wall systems, intricate cabinet door styles, molding and so much more.
However, the biggest attraction was the new line of solid colors that have the look and feel of painted doors. With a rise in contemporary designs that feature solid color doors; Synergy sought after an RTF solution. The introduction of STF Deep Blue Sea and Gun Metal Grey is the beginning of our Solid Paint collection, with corresponding Sherwin Williams colors: Gale Force (SW 7605) and Gauntlet Grey (SW 7019), respectively. These two colors generated plenty of buzz and were featured in some of the hottest design trends seen at some of the world’s largest furniture and interior design shows such as NeoCon and Interzum.
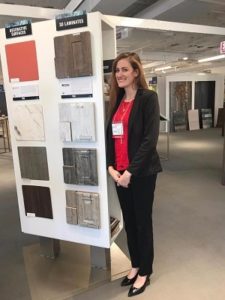
Also featured was our in-depth matching program that featured some of the corresponding products utilized in completing flawless and cohesive designs. On this feature wall, we had our Barnwood, Smokewood and Silverwood displayed with the matching edbanding and 2D film stocked by STF along with the corresponding TFL and HPL matches as well.
U.S. Labor Market Roars Back to a 16-Year Record Low
July 2017
Exceeding expectations, the U.S. labor market has continued the trend of adding U.S. jobs to the market. The labor department released its June statistics and the numbers have surprised many. Total non-farm payroll employment has increased by 222,000 in June, 47,000 more jobs than expected by economists. “The payroll number is well above expectations,” said Jim O’Sullivan, chief United States economist at High-Frequency Economics.
The unemployment rate was little changed at 4.4%, this steadying of the unemployment rate can be attributed to an increase of individuals entering the U.S. workforce. However, with a shrinking available labor pool, companies are trying to ramp up their hiring for skilled workers. According to Career Builders 2017 Midyear Job Forecast, approximately 60% of employers are looking to bring in more workers, a 20% rise from a year ago.
The economic expansion is now entering its ninth year with the lowest unemployment rate in 16 years. Some feel it has reached full capacity. With a level that’s this low, unemployment has more room to go up than down. The U.S. has added jobs every month since October 2010, a record 81-month stretch that added 16 million workers and slowly repaired much of the damage from the 2007-09 recession. The unemployment rate touched a 16-year low and the number of job openings hit a record earlier this year.
Greys are here to stay
July 2017
White and black have always had a prominent place in cabinet designs, however, there has been a surge of gray tones. The popularity of sleek, sophisticated gray color schemes have soared in the last few years and has no outlook to stop. Staying on top of today’s trends STF has released Battleship Grey, a new solid matte gray. With matching TFL from Tafisa (Sundown L768), this color is bound to have a timeless look for any completed project.
NeoCon in Review: June 12-14, 2017
July 2017
As the premier commercial design and furniture trade show in North America, NeoCon 2017 introduced the up-and-coming design trends we are likely to see in the next year. Hosted in downtown Chicago at the Merchandise Mart, this year’s NeoCon attendance increased 7% over 2016.
2017  ’s design trends focused on neutral tones and wood grains, segmented with pops of color. Sit/stand products, privacy pods, ergonomic seating, integrated technologies and high-performance textiles were also among top trends seen throughout the show.
STF had a product showcase in the Material Intelligence booth, showcasing our comprehensive matching program. This allowed us to highlight the multitude of uses for RTF and cultivate interest for thermofoils as a solution in the commercial design industry.
AWFS July 19-22, 2017
July 2017
STF will be at this year’s AWFS Fair July 19-22, 2017. As 2017’s largest North American woodworking show there are 600+ exhibitors and over 15,000 industry professionals; you can immerse yourself in the industries latest technology and trends
Join STF at Booth 7450 to see our new stock additions: Deep Blue Sea, Battleship Grey, and Gun Metal Grey. Plus, we would love your feedback on our stock range of PET Super Matte and Ultra High Gloss laminates. Feel free to contact us for entry tickets.
U.S. Housing Inventory at a 20 Year Low
June 2017
Economic conditions in the U.S. have remained steady over the past year, giving many people the opportunity to purchase a home. A solid job market, average pay increases and historically low mortgage rates; people across the U.S. are looking to make that transition from renter to owner occupancy.
However, they face one major issue: trying to find a house.
The national supply of homes has reached a 20 year low and over the past year the steepest drop in supply has occurred among homes that are typically the most affordable for first-time buyers. April 2017 had a 5.7 month supply of homes a slight increase over March 2017 figure of 4.9 supply, however not nearly enough to meet the current demand.
Across different housing segments, starter and trade-up home inventory fell 8.7% and 7.9% year-over-year nationally, respectively. Meanwhile, the stock of premium homes remained relatively unchanged since last year, having fallen just 1.7%.
With a limited number of property listings amid solid demand, sellers have little reason to reduce asking prices. Housing not only has become difficult to find but also difficult to purchase due to rising housing costs. Starter homes median price has increase 8.3% during the first quarter of 2017 over 2016, while trade-up homes and premium home prices have risen 6.8% and 7.2%, respectively.
Among the factors that have fueled the decline in housing inventory are:
- Homeowners are staying in their houses longer, averaging 8 years. Nearly doubled since 2008
- Investors hold a large share of properties, utilizing them as rental properties. In 2016, investor owned housing increased to 35% of the market share, up 5% over the last 10 years average of 30%.
- Pace of income growth is lagging behind property values, affordability constrains mean rental demand will remain robust. Investors are reluctant to give up property.
While the long term solution for the housing market would be for builders to replenish the stock of new homes, they cannot seem to do it fast enough. Builders are completing homes at 65% of the rate they have historically. Builders are also faced with challenges such as the lack of ready-to build lots, costly regulations and a chronic shortage of skilled construction workers.
Despite the scant supply, U.S. home sales are expected to rise this year, economists say. Fueled by job growth, pay raises and still-low loan rates — and perhaps fearful of being left out as more homes are snapped up and prices rise further — many people are looking to buy.
Residential Furniture Sales on the Rise
June 2017
According to the most recent report by Smith and Leonard, residential furniture orders rose 12% in March compared to March 2016 and 17% higher than February 2017 orders. New orders were up 77% of the surveyed participants.
Although consumer confidence looks to be positive, “Converting that confidence to more activity seems to be the trick,” said Ken Smith, managing partner at Smith Leonard. “The March results of our survey were maybe a bit higher than we expected. Though most of what we had heard prior to the High Point Market had indicated that business had picked up. With over three-fourths of the participants reporting increases in orders, those expectations seemed to carry over into what we thought was a pretty good market.”
He added, “While the overall economic conditions in the U.S. continue to be a bit sluggish, the key factors continue to be somewhat strong. While housing is off a bit, the stock market has been very strong; inflation is not bad except for energy indexes and retail in general is positive, along with good consumer confidence. All of this together should continue to produce more furniture sales along the rest of the year.”
For more information, please visit Smith & Leonard
Seas The Day
June 2017
Dive right in with STF’s latest addition, Deep Blue Sea. This beautiful deep blue solid matte RTF is the latest design trend for kitchen cabinets, closets and accent pieces. This color will catch everyone’s attention as whole kitchen or as an accent piece. Matching TFL can be found from Panolam (Deep Blue LL40) and HPL from Nevamar (Deep Blue S3022).
Go ahead and test the waters and request a sample now!
Construction Dilemmas
May 2017
Thirty-nine states added construction jobs between March 2016 and March 2017 while 17 states added construction jobs between February and March, according to an analysis by the Associated General Contractors of America of Labor Department data released today. Association officials noted that contractors in most states remain busy for now but worry about not being able to find enough workers to complete projects in the future.
California had the highest increase in construction jobs with 42,000 jobs added in the past year, followed by Florida with 36,500 jobs and Texas with 18,900 construction positions.
Construction jobs are projected to increase 6.5% by 2024 according to the U.S. Department of Labor Statistics due to an increase in residential and non-residential construction. The demand for single-family housing and multi-family housing has greatly increased due to a lack of inventory of available homes.
During March 2017, according to estimates released by the U.S. Census Bureau and the Department of Housing and Urban Development, there was a 5.8% increase of new home sales over February 2017. This was also a 15.6% increase over March 2016 estimates. This represents a supply of 5.2 months at the current sales rate.
While construction has continued to expand, the industry is now hitting a wall. The lack of skilled tradesmen has been sharply felt within the past few years. Most contractors are quoting longer completion times or passing up opportunities to big on new projects as a way of coping with shortages of available qualified workers.
According the study “Young Adults & the Construction Trades” by the National Association of Home Builders (NAHB) only 3% of individuals between the ages of 18-25 want to work in construction trades and 26% of individuals said they were uncertain of career paths. Of those 26% of respondents, only 18% said they would consider the construction industry if the pay was high enough. While 68% of the uncertain respondents would not consider the construction industry even if the pay was satisfactory said that the jobs were too physically demanding or that construction work was difficult.
The lack of skilled tradesmen have led to government intervention. North Idaho College has been awarded a $482,582 grant by the Idaho Department of Labor to train more than 200 workers in the wood products manufacturing industry and Michigan lawmakers have passed a budget that would offer increased funding for skilled trades.
Market Trends: Decorative Laminates
May 2017
Decorative laminates have steadily increased in use since 2010 as a cheap and durable alternative to traditional wood products. With rising housing starts and increases in commercial construction following the housing bubble burst in 2008, the demand for cost effective building materials increased and caused a shift towards decorative laminates.
According to the report “Decorative Laminates Market” by Markets and Markets ™, the decorative laminate market is estimated to grow from $6.71 billion in 2016 to $8 billion by 2021, at a CAGR of 3.5% from 2016-2021.
Based on end-use sector, the non-residential sector led the decorative laminates market in 2016 followed by the residential sector. The non-residential sector is forecasted to continue the lead, decorative laminates are being utilized in restaurants, laboratories, educational institutes, office furniture, hospital, hotels, and retail shops.
Decorative laminates are estimated to surpass 12 billion square meters by 2023 with thermoplastic films and saturated papers growing the fastest, according to the Fredonia Group.
Thermoplastic films which include polyvinyl chloride (PVC, also referred to as 3D laminates) and polyester (PET) films are growing in popularity due to long term durability and cost effectiveness. Over the years, changes in film composition allows for adding highly durable top coats and wear layers which increase scratch resistance and longevity of the finished product. There is also a vast array of design options ranging from wood grains, solids, stones, and abstract patters accompanied by various finishes such as high gloss, supper matte and deep emboss textures.
For residential consumers the design flexibility allows users to achieve exotic high end looks without consuming virgin wood or mineral resources that does not sacrifice look and feel of the space. For non-residential users 3D laminates are utilized for their distinct properties such as durability, high impact strength, cost effectiveness, variety, microbe-resistant, easy to maintain, customizable, easy installation, and lavish elegant looks. Non-residential uses can be seen in store fixtures, sculpted wall panels, office furniture products and specified healthcare applications.
Builder Confidence Reaches 12 Year High
April 2017
According to the National Association of Home Builders and Wells Fargo Housing Market Index (HMI) builder confidence in the market for newly build single-family homes jumped six points to a level of 71. This is the highest builder confidence reading since June 2005.
The HMI benefited from unseasonably warm weather at the start of 2017 which improved demand and construction conditions. While builders are extremely confident, there is expected to be some restraint moving forward. There are challenges that they continue to face including shortages of lots and labor, increasing mortgage rates and rising material prices.
Derived from a monthly survey that NAHB has been conducting for 30 years, the NAHB/Wells Fargo Housing Market Index gauges builder perceptions of current single-family home sales and sales expectations for the next six months as “good,” “fair” or “poor.” The survey also asks builders to rate traffic of prospective buyers as “high to very high,” “average” or “low to very low.” Scores for each component are then used to calculate a seasonally adjusted index where any number over 50 indicates that more builders view conditions as good than poor.
Residential Construction Spending Continues at Highest Level Since 2007
April 2017
Residential construction spending continues on its fifth consecutive month of growth. According to data released by the U.S. Census Bureau and the U.S. Department of Housing and Urban Development private construction was at a seasonally adjusted rate of $917.3 billion for the month of February with $484.7 billion on residential construction. This is a 1.8% increase above the residential construction spending in January and up 6.4% from the same period one year earlier. This is the highest level since August 2007.
Multifamily construction spending also continued record breaking growth with a 2% increase to $64.5 billion over January 2017 and a 10.7% increase over February 2016. Single family construction spending also improved by 1.2%, continuing steady growth since October of 2016.

 This year’s AWFS Fair was a whirlwind experience like no other. Hosted in Las Vegas, Nevada on July 19-22, 2017, the biennial event boasted a 17% attendance increase over 2015. With over 18,000 participants, there was a flurry of excitement in the packed halls with everyone eager to see the latest technology and design trends.
  ’s design trends focused on neutral tones and wood grains, segmented with pops of color. Sit/stand products, privacy pods, ergonomic seating, integrated technologies and high-performance textiles were also among top trends seen throughout the show.